The Power of Netflix on Consumer Behavior
Part of the attraction to Netflix is that consumers feel like they aren’t bombarded with advertising. While that is true, the reality is that whatever you watch on Netflix, it’s still having a significant impact on your consumer behavior.
We are all guilty of binge watching more than our fair share of shows, particularly since the start of the COVID-19 pandemic. Which made the research team here at SPS Commerce wonder, how are popular Netflix shows impacting retail buying trends?
Thanks to Google, we’ve been able to accumulate the consumer demand data by cross-referencing search data with the most popular 2020 Netflix show debut dates.
And although search data isn’t quite available for the 2021 hit show Bridgerton, we’ve taken a look at trends on eBay to find total sales for featured products before and after its release.
Bridgerton’s Effect on Retail in The United States & The United Kingdom in 2021
Netflix revealed Bridgerton is officially the most watched show in Netflix history. A record-breaking 82 million households around the world have tuned in for this Regency-era classic.
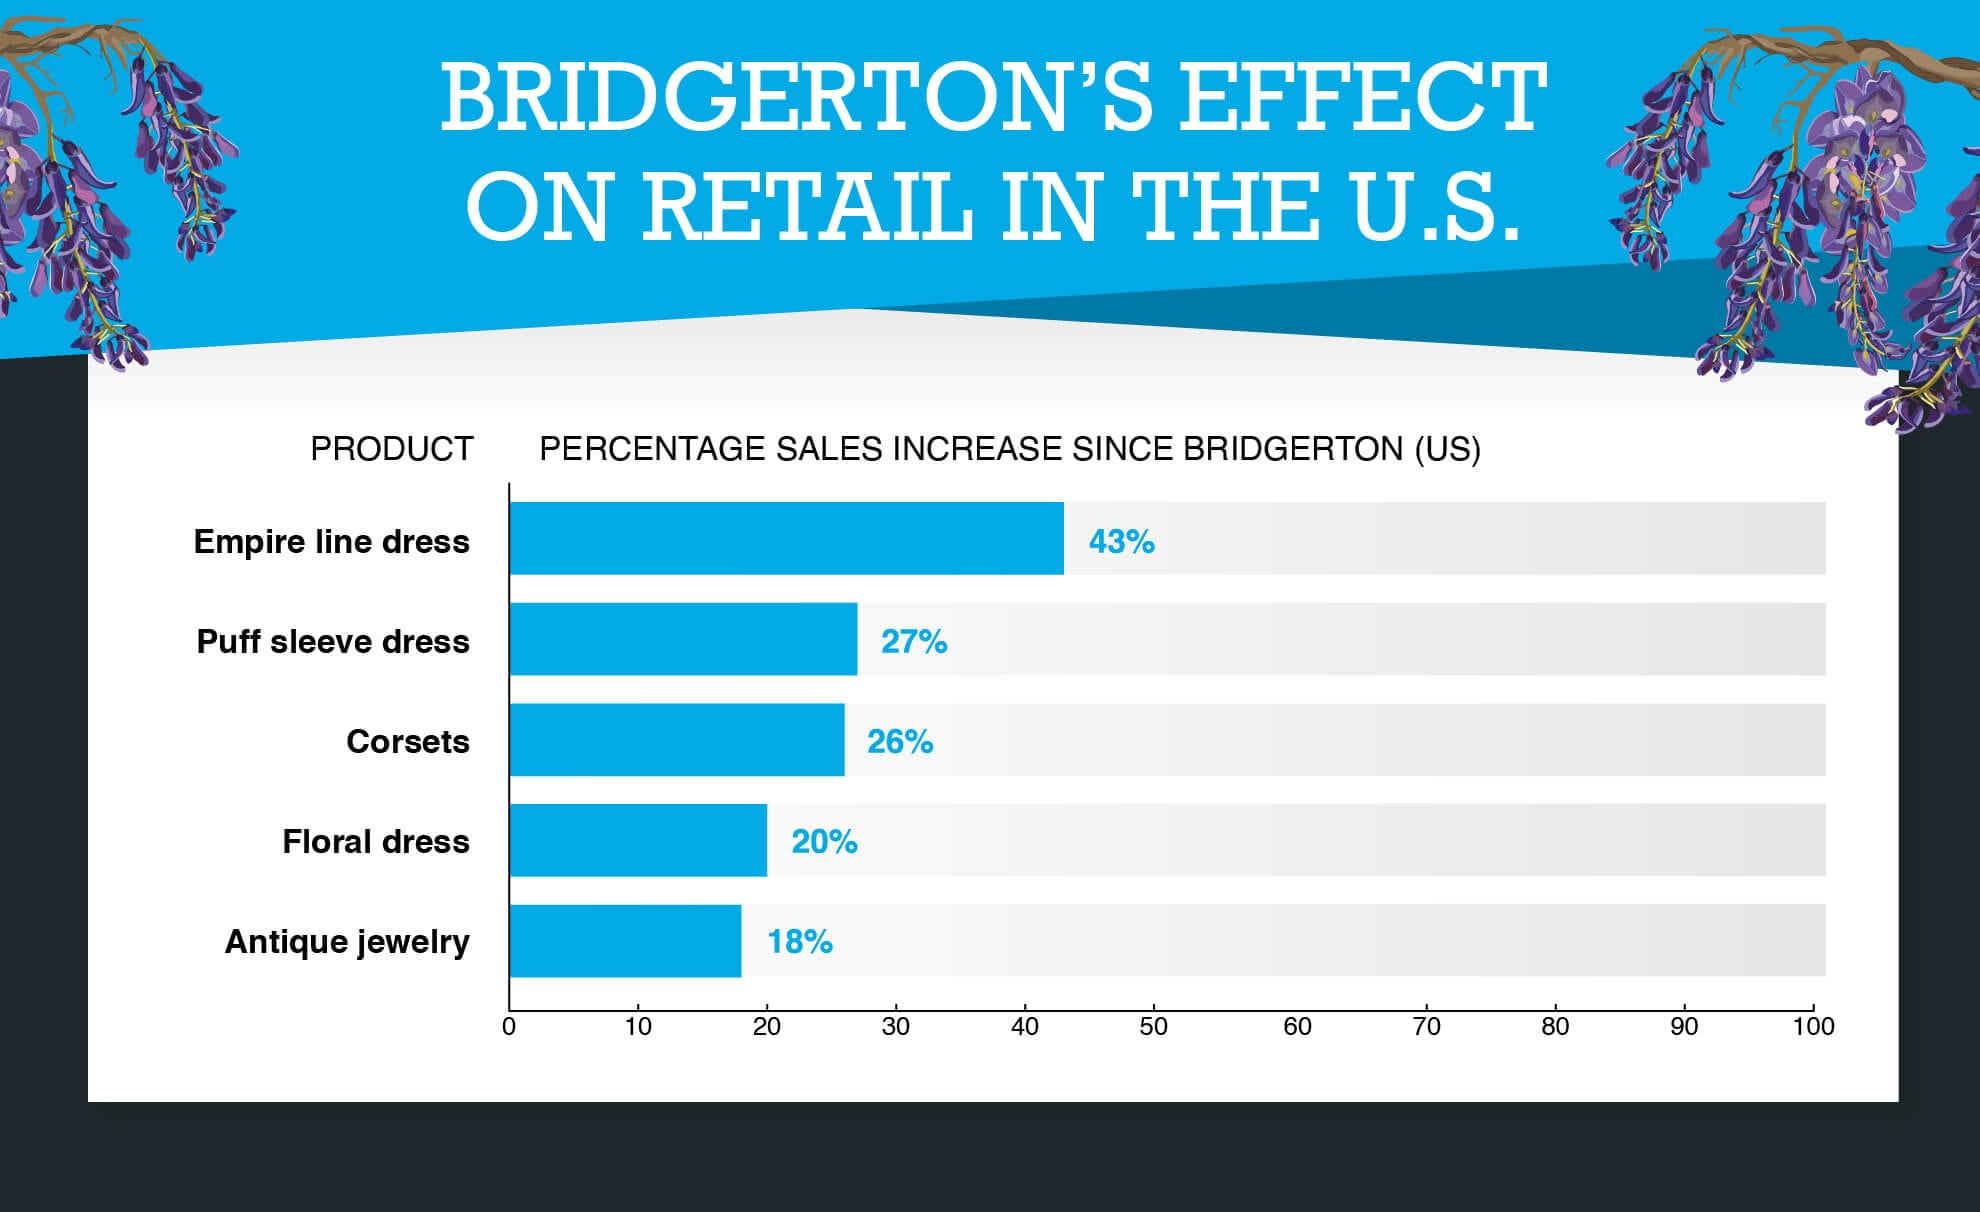
The response has truly been phenomenal and it’s effecting the retail market. Using eBay (or more specifically eBay Seller Hub’s research feature), we’ve identified how sales have surged for fashion items featured in Bridgerton since its release.
Empire line dresses look to make a comeback thanks to the leading ladies in Bridgerton. Expect to see more puff sleeve dresses too, as well as corsets, floral patterns and even antique jewelry.
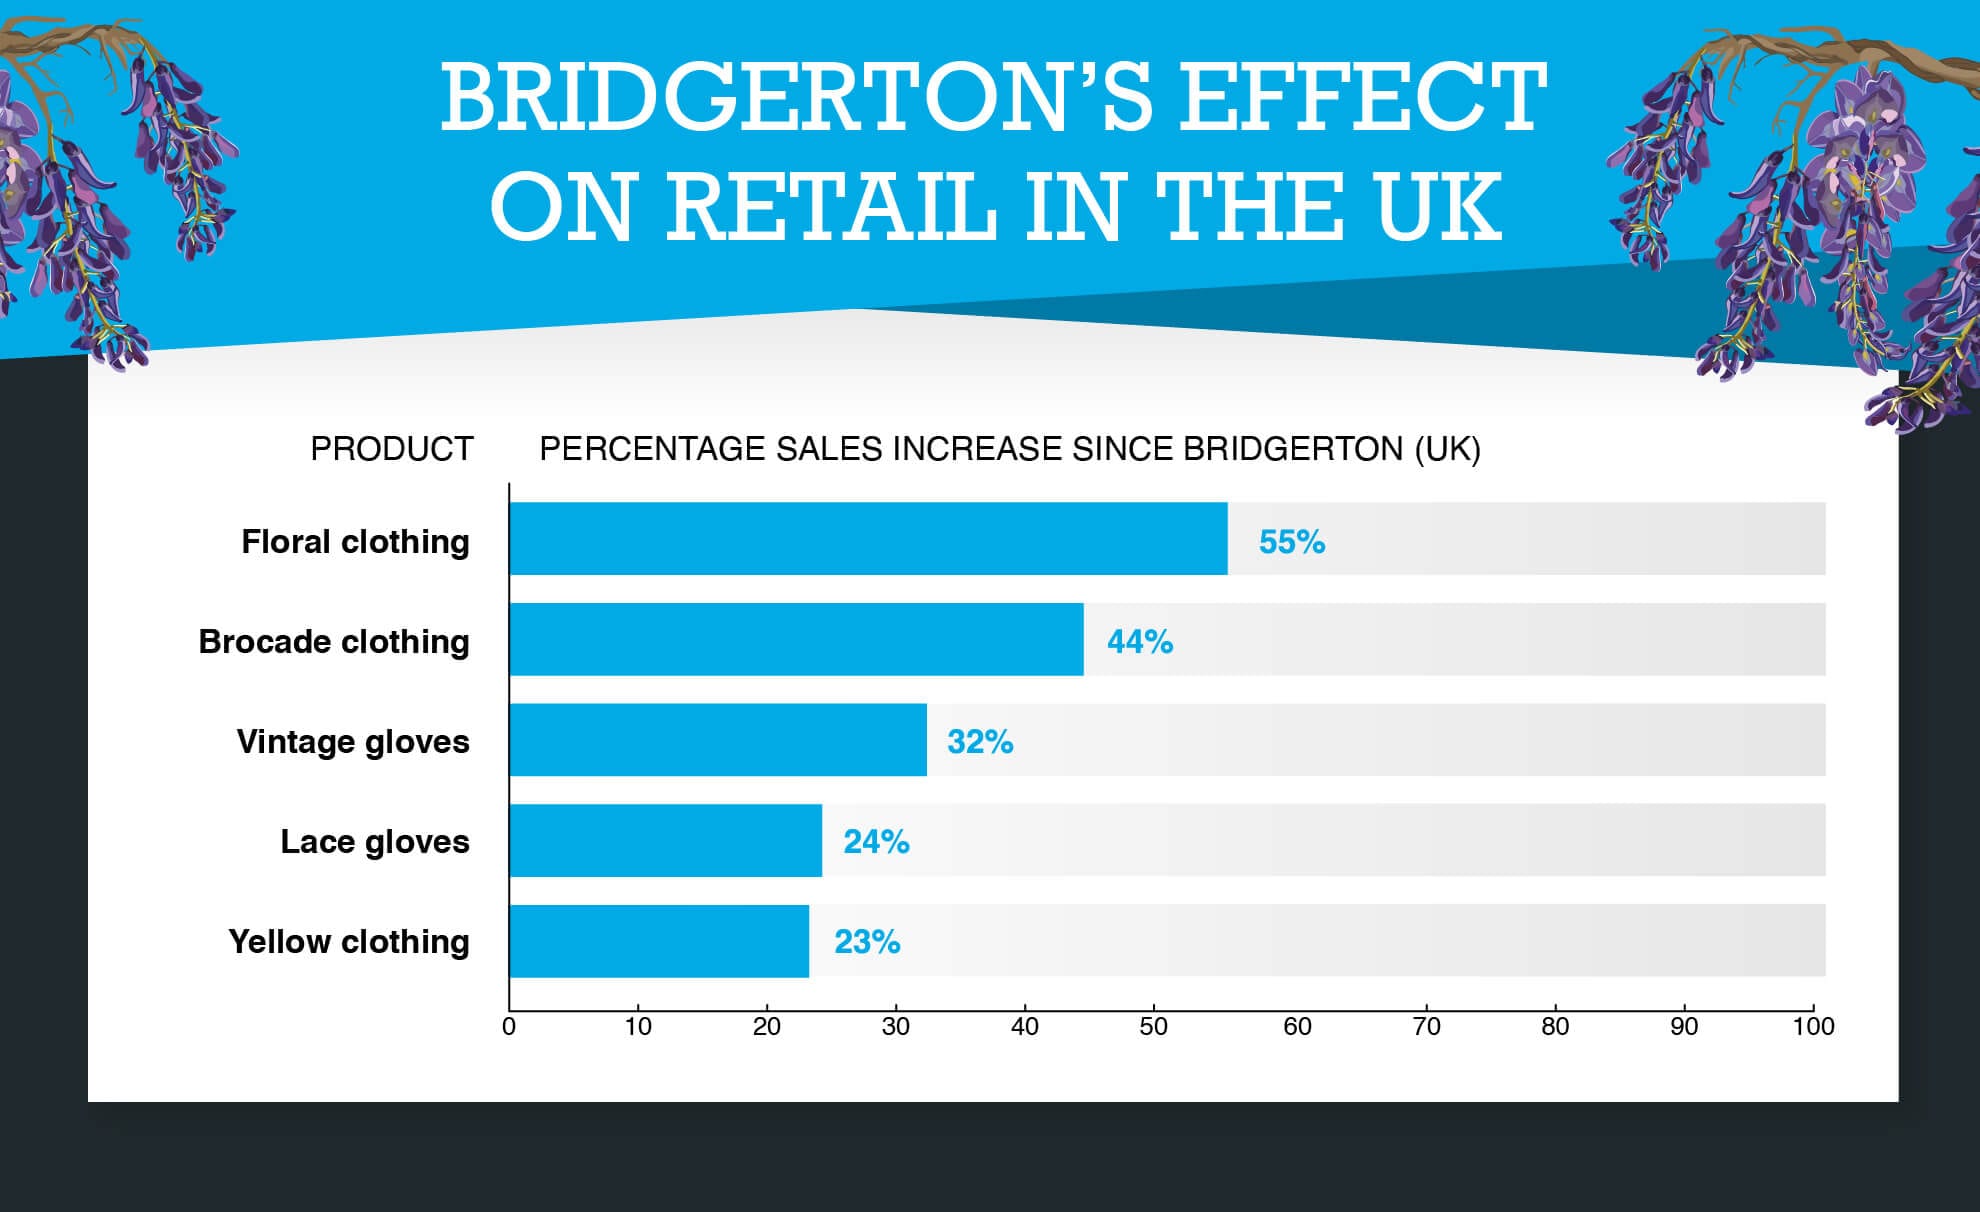
Interestingly, the effect on the fashion retail market is even stronger across the pond. The UK reports a higher sales surge for featured Bridgerton fashion items.
Similar patterns do emerge though, with ‘floral clothing’ seeing a 55% increase in total sales. The UK seem to be more intrigued by the gloves (both vintage and lace) on show during Bridgerton. While brocade clothing and yellow clothing (assumedly down to Penelope Featherington and Marina Thompson who famously showcase yellow dresses) have also seen increases in sales on eBay.
It seems that it isn’t just independent eBay sellers that are capitalizing on this surge in demand for Bridgerton fashion products, as independent corset sellers are seeing surges in website traffic. Users are flocking to both independent fashion specialists, vintage/antique stores and larger retailers to get the Bridgerton wardrobe.
The Most Influential 2020 Netflix Viewing within The United States
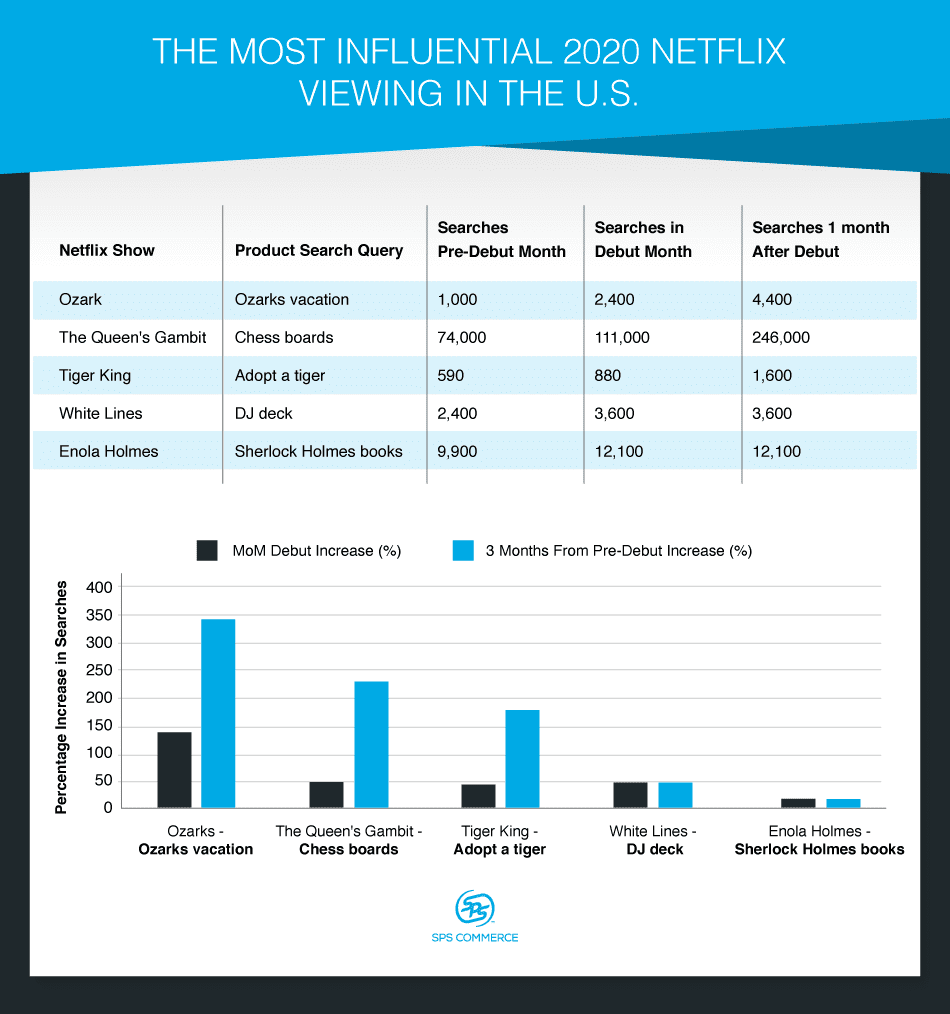
We were all stunned by the mind-blowing ending of Ozark Season 3 (pun intended). And the shocks continue as we can reveal this season led to a 340% increase in demand for vacations to the Ozarks. Other notable mentions include The Queen’s Gambit. It has been the go-to show over the past few months, but sensationally it has increased retail demand for ‘chess boards’ by over 232%.
Tiger King (tiger adoption), White Lines (DJ decks) and Enola Holmes (Sherlock Holmes books) make up the rest of the top 5. Interestingly, this is the same in the UK but White Lines had more of an effect on ‘Ibiza holiday’ over ‘DJ decks’.
Recurring Phenomenons
There are some shows that are such a success each year a new season comes out, it has a repeated effect on consumer behavior without viewers being any the wiser.
Stranger Things and ‘80s Fashion’
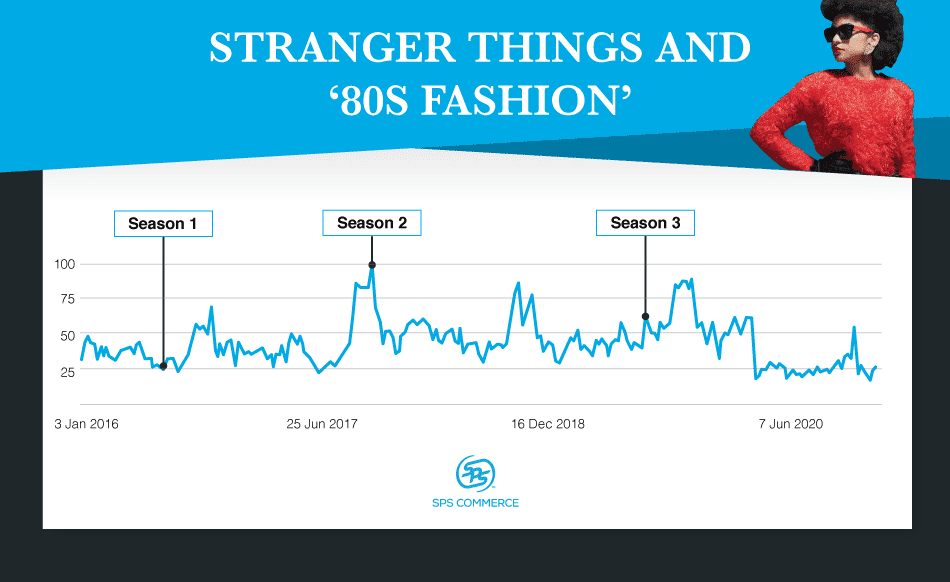
The above graph is based on Google Trends, a freely available tool released by Google. This indicates search popularity from 2016 (the debut year for Stranger Things) to the end of 2020 worldwide.
We can see clearly the impact that Stranger Things has each time it debuts another season. With season 2 correlating with the most popular time users searched for ‘80s fashion’. This renders it likely that the eagerly anticipated season 4 will have a similar effect.
From a retailer’s perspective, they can often be caught off guard by the surge in popularity for their products. For example, in season 2 of Stranger Things Dustin wore a sweatshirt from The Science Museum of Minnesota. If retailers can act quickly, they will be able to capitalize on surprise product placements to great reward. The Science Museum of Minnesota were able to shift 10,000 sweatshirts worn by Dustin in just one day.
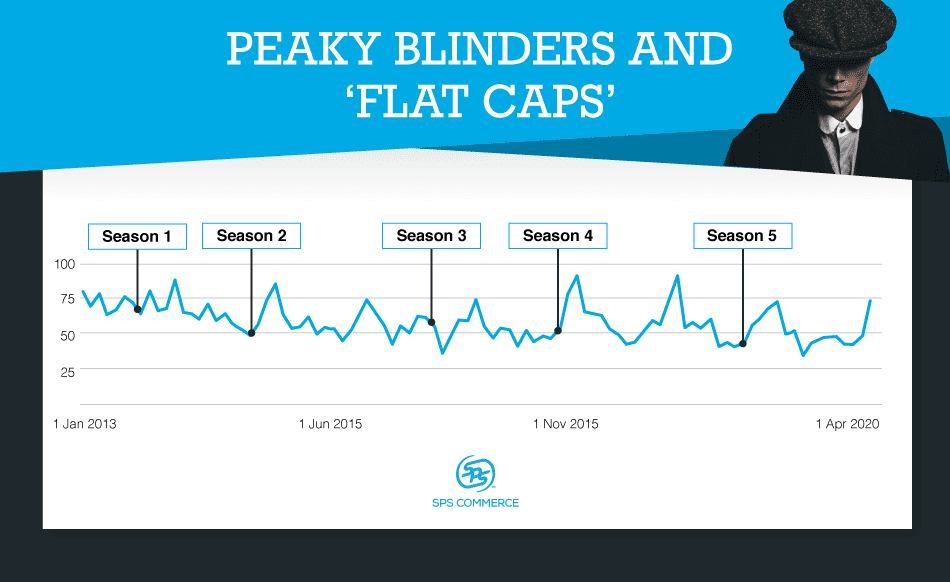
Peaky Blinders and ‘Flat Caps’
Until quite recently, ‘flat caps’ were considered a thing of the past. Something that may have been considered a staple during the post-war period but has been lacking popularity since.
That was, of course, until Peaky Blinders debuted in 2013. Although it took a while for this to take an effect (assumedly due to the show’s relatively slow burn in becoming a worldwide phenomenon), the correlation between the series and retail trend of flat caps are undeniable.
Conclusion
The power of Netflix on consumer behavior is something all retailers need to be aware of. The way we consume our media is changing. And retailers need to be on top of these changes.
If you are lucky enough to have your products featured on a hit Netflix show, you’ll need to do more than just sit back and enjoy the limelight.
Trends don’t last forever. And you can see from our research how quickly demand can drop for products after the shows have aired. ‘Flat caps’, for example, saw their highest demand levels correlate to the debut of Peaky Blinders season 4. But roll the clock to 6 months later and popularity had dropped 38%.
By ensuring you are monitoring popular culture (and Netflix product placements), you can ensure you have enough supply of your product to capitalize and your retail sales will not disappoint.
If you use retail analytics software, you should be able to identify spikes in demand for your products easily. Do some digging into why this may be. If it’s some form of product placement, remember to act quickly with your supply lines as it’s likely to be short lived. But the sales potential for SMEs is tremendous (just ask The Science Museum of Minnesota).
Methodology
Bridgerton’s Effect on Retail in The United States & The United Kingdom in 2021
Data from eBay was used instead of Google, as Google Keyword Planner hasn’t released data for 2021 quite yet. However, by using direct sales data we were able to get even more granular data on how it is directly impacted on retail sales.
We used the research tool on eBay Seller Hub (in partnership with Terapeak) for all featured fashion products on Bridgerton.
The Most Influential 2020 Netflix Viewing in The U.S
We went through a list of all Netflix viewing for 2020 and brainstormed all products that were featured in each show individually. If shows had no obvious featured products, they were ignored from our analysis.
All brainstormed featured products were input into Google Keyword Planner and filtered for the U.S. to ensure that the most popular phrasing for said product had been used.
After the correct phrasing had been identified for said product, we filtered the dates on Google Keyword Planner to find the exact number of searches for:
- The month before said Netflix show debuted
- The month during the said Netflix show aired
- The month after the said Netflix show aired
Month over Month calculations were made separately for both the month during the air date and the month after. Both MoM calculations used the month before the debut date as its comparison month. The following equations were used:
Month 2 – Month 1 / Month 1 * 100
AND
Month 3 – Month 1 / Month 1 *100
Netflix air dates were achieved by Googling each show respectively.
Recurring Phenomenons
For this, we similarly brainstormed featured products for the most popular Netflix shows of all time and repeated our process from our 2020 technique. However, this time we input our featured product into Google Trends, and started the Trends analysis from the year of the first season debut.
Both Stranger Things and Peaky Blinders seemed to have the strongest recurring correlation with their said featured product.
- The Power of Netflix on Consumer Behavior - January 13, 2021

RELATED POSTS
4 strategies to conquer lean inventor...
6 Advantages of Integrating Your Info...
Best Practices to Drive Sell-Through